
Grading an article’s difficulty means calculating what percentage of its word tokens you already know, then mapping that number to a simple band and recommendation. This is per-user lexical coverage, and it’s the metric that actually predicts whether a text will feel readable to you specifically, not to some average learner.
A working grading system should output three things instantly:
- A coverage percentage (say, 96%)
- A band label (“Near-fluent,” “Needs support”)
- A one-line recommendation (“Read it,” “Look up a few words first,” “Try something easier”)
Laufer & Ravenhorst-Kalovski (2010) established the coverage thresholds this system leans on. Schmitt, Jiang & Grabe (2011) confirmed the underlying relationship between known words and comprehension. WordByWord builds this directly into its comprehension-level indicator, so the calculation happens before you commit to reading.
Key Takeaways
Personalized lexical coverage, not generic readability formulas, is the metric that reliably predicts whether a specific learner will find a specific text readable.
| Point | Details |
|---|---|
| Coverage is per-user | Grade difficulty by the percentage of tokens the individual learner already knows, not a universal score. |
| Use research-backed bands | Treat 95% and 98% coverage as practical, probabilistic benchmarks from Laufer & Ravenhorst-Kalovski, not hard cutoffs. |
| Matching strategy changes results | Word-family or lemma matching reports higher coverage than exact-form matching for the same text. |
| Pair coverage with behavior | Combine the percentage with reading speed and lookup frequency for a more accurate difficulty read. |
| WordByWord automates this | Its comprehension-level indicator and Spotlight mode compute and display personal coverage in real time on any page. |
Table of Contents
- What You Need Before You Can Compute Coverage
- How Do You Calculate Lexical Coverage Step by Step?
- What Do the Difficulty Bands Actually Mean?
- How Should a Browser Extension Display This?
- What Coverage Doesn’t Tell You
- Quick Implementation Checklist
- Try Personalized Difficulty Grading in Your Browser
- Frequently Asked Questions
- Sources
What You Need Before You Can Compute Coverage
Two data sets have to exist before any percentage means anything: your known-vocabulary list and the target text, tokenized.
Your known-word list needs a clear representation. Do you store exact forms (“running,” “ran,” “runs”) or collapse them into a word family under “run”? Word-family mapping is more forgiving and closer to how vocabulary size research treats word knowledge, but it costs more compute and can overstate what you actually recognize on sight. Lists typically export as CSV or JSON, which matters if you’re moving data between tools.
Tokenizing the text raises its own decisions:
- Lowercase everything, or treat “Apple” and “apple” differently?
- Split contractions (“don’t” → “do” + “n’t”) or keep them whole?
- Strip punctuation before or after counting tokens?
- Count numbers and proper nouns in the denominator, or exclude them as “free” content?
None of these choices is objectively correct, but they need to stay consistent, or your coverage percentage will drift for reasons that have nothing to do with your vocabulary.
Pro Tip: If your extension syncs known-word lists across devices, keep the raw list local first and sync only a hashed or compressed version. It’s faster, and it avoids exposing your entire vocabulary history to a server round trip every time you open a page.
How Do You Calculate Lexical Coverage Step by Step?
The algorithm is simple enough to run in a browser tab without a server call. Here’s the sequence:
- Tokenize the article into individual word tokens, applying your chosen rules for punctuation and case.
- Normalize each token, either to its lemma or its word family, depending on your matching strategy.
- Match each normalized token against your known-vocabulary set.
- Count matched tokens (the numerator) and total tokens (the denominator).
- Divide numerator by denominator to get coverage percentage.
- Map that percentage to a display band.
The matching strategy in step 3 changes your result more than any other variable. Exact-form matching is stricter and will usually report lower coverage than lemma matching because it won’t credit you for knowing “walk” when the text uses “walked.” Word-family matching is the most generous and the closest to how frequency-band research measures vocabulary growth since it recognizes that knowing “run” implicitly covers “running” for most learners.
Here’s what the calculation looks like on a short sample:
| Token | Normalized form | Known? | Running coverage |
|---|---|---|---|
| The | the | Yes | 1/1 = 1.0 |
| markets | market | Yes | 2/2 = 1.0 |
| fluctuated | fluctuate | No | 2/3 = 0.67 |
| unpredictably | unpredictable | No | 2/4 = 0.5 |
| this | this | Yes | 3/5 = 0.6 |
| quarter | quarter | Yes | 4/6 = 0.67 |
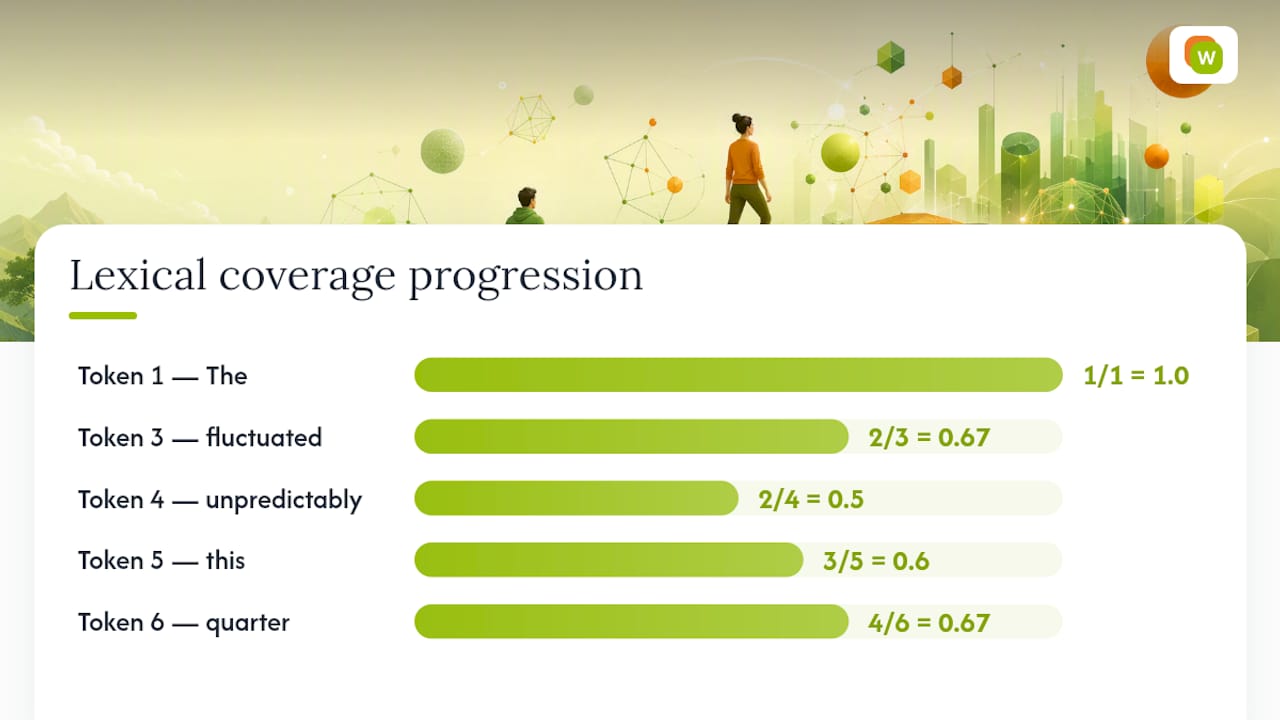
A real implementation runs this across every token in the article, not just six, but the mechanics scale identically.
What Do the Difficulty Bands Actually Mean?
Coverage percentage only matters once it’s translated into a band a learner can act on without doing math. A practical set looks like this:
- Below 90% — “Too hard for now.” Word-level processing will dominate; expect frequent lookups and slow reading.
- 90 to 94% — “Challenging.” Readable with effort, good for active study sessions, not casual reading.
- 95 to 97% — “Supported reading.” Laufer & Ravenhorst-Kalovski tie roughly 95% coverage to minimal supported comprehension, requiring an estimated 4,000 to 5,000 word families depending on the language.
- 98% and above — “Near-fluent.” Independent reading with minimal disruption, associated with 8,000 to 9,000 word families in the same research.
Treat these as probabilities, not hard gates. The relationship between coverage and comprehension trends largely linear rather than a clean cliff edge, so a 93% article isn’t automatically unreadable, and a 96% article isn’t automatically comfortable.
Pro Tip: When a learner sits at 92 to 94% coverage on a topic they care about, nudge toward “read anyway” rather than “choose easier.” Motivation from graded input slightly above current level often outweighs the friction of a few extra lookups.
How Should a Browser Extension Display This?
The metric is only useful if the interface makes it instantly legible. A real-time indicator should show the percentage, a color band, and a short verb phrase, something like “96% — Readable,” rendered before the learner starts reading, not after they have given up halfway through.
Per-article scoring works for scanning and deciding what to open next. Per-paragraph or per-sentence scoring works for deep reading, since coverage can swing wildly within one article, a simple intro followed by a technical middle section. Offering both, with a toggle, covers most reading habits.
Highlighting unknown words inline, with hover definitions and a one-click “add to vocabulary” action, turns the score from a gatekeeper into a working tool. WordByWord’s Spotlight mode does exactly this: unfamiliar words stand out on the page itself, and the highlights fade as you actually learn them, which keeps the difficulty score current instead of static.
- Beginner-facing UI: larger bands, simpler labels (“Easy,” “Hard”), fewer numbers on screen.
- Intermediate UI: exact percentage, band label, and unknown-word count.
- Advanced UI: percentage plus per-sentence breakdown for targeted study.
Known-word lists should default to local storage, with cloud sync as an opt-in rather than automatic, since vocabulary history reveals a lot about a learner’s habits and level.
What Coverage Doesn’t Tell You
A coverage score estimates cognitive load, not comprehension itself, and treating any single percentage as a pass or fail cutoff misleads more than it helps. Higher coverage frees attention for following the argument; lower coverage forces word-by-word decoding, which is a different reading experience entirely.
Several factors bend the coverage to comprehension relationship in ways a raw percentage misses:
- Prior topic knowledge. A 92% coverage article on a subject you know well can read easier than a 96% article on something unfamiliar.
- Genre and cohesion. Dense academic prose taxes comprehension harder than conversational text at the same coverage level.
- Multiword expressions. Idioms and collocations can inflate a coverage score while comprehension still lags.
- Text length. Longer texts compound the effect of unknown words as fatigue sets in.
Replication attempts on the original 98% breakpoint have produced mixed results across different learner populations, which is exactly why the number should guide a decision, not dictate one.
The practical fix: pair coverage with behavioral signals. Reading speed, lookup frequency, and time-on-page tell you more about real difficulty than a static percentage ever will alone.
Quick Implementation Checklist
For anyone building this into an extension or a personal script, the build order matters:
- Export your known-word list in a consistent format (CSV or JSON).
- Decide on a matching strategy: exact-form, lemma, or word-family.
- Build or select a tokenizer and normalizer for your target language.
- Compute coverage and map it to a band.
- Display the band with a short recommendation, not just a raw number.
- Log results locally first, syncing only with explicit consent.
Sanity-check the system against a text you already know is easy and one you know is hard. If both return scores that match your gut sense, the pipeline works. Cache computed scores per article and update incrementally as your known-word list grows, so re-scoring doesn’t require reprocessing every token from scratch.
Why personalized coverage beats generic readability scores
Generic readability formulas score a text the same way for every reader, which is exactly the problem. Two learners can hit wildly different comprehension on the same article because their known-vocabulary inventories differ, and a formula blind to that will send one of them into a text that is genuinely too hard. Per-user coverage also does something a static score can’t: it flags exactly which words are blocking you, which turns a difficulty score into a study list. That’s the loop WordByWord is built around, and it’s why we think it belongs in a Chrome extension rather than a one-time readability report.
Try Personalized Difficulty Grading in Your Browser
WordByWord runs this exact coverage calculation on every page, PDF, and YouTube video you open, using the vocabulary you’ve already tracked rather than a generic word list. The comprehension-level indicator shows your percentage before you commit to reading, and Spotlight mode highlights unknown words directly on the page, from unfamiliar to mastered, so you see at a glance what’s blocking you.
Every word you save from an article becomes a flashcard ready for spaced repetition, so the same coverage score that told you what to read also builds the collection that raises your next score. If you’re already tracking known vocabulary manually or through another vocabulary tracking method, importing it into WordByWord takes a CSV upload. From there, every article, PDF, and video you open gets graded against your real vocabulary automatically. Install the extension and open any article you were on the fence about reading.
Frequently Asked Questions
What does it mean to grade an article by difficulty? It means calculating what percentage of the article’s word tokens you personally already know, then converting that percentage into a readability band like “Supported reading” or “Near-fluent.”
Not always. It’s a practical benchmark tied to minimal supported reading in Laufer & Ravenhorst-Kalovski’s research, but genre, topic familiarity, and text length all shift how much a given percentage actually helps.
Should I use exact-word matching or word families to grade difficulty? Word-family matching gives a more forgiving, usually more accurate picture of what you can actually read, since it credits related forms like “run” and “running” as one known item.
Can a browser extension calculate this automatically? Yes. An extension that already tracks your known vocabulary, like WordByWord, can tokenize a page’s text and compare it against your word list in real time, showing the coverage percentage before you start reading.
Why not just use a standard readability score instead? Standard formulas score every reader the same way and ignore your specific vocabulary gaps. Personalized coverage tells you which words are actually blocking you, not just how long the sentences are.
Sources
The papers behind this method each answer a different piece of the coverage puzzle. Laufer & Ravenhorst-Kalovski (2010) set the 95% and 98% thresholds. Schmitt, Jiang & Grabe (2011) linked percentage-known to measured comprehension scores. The Hu & Nation replication work tested whether those thresholds hold across different learner groups.
For implementation details, see WordByWord’s guide to tracking vocabulary while reading and its breakdown of extensive versus intensive reading strategies for choosing what to read once you know your score.
- The Percentage of Words Known in a Text and Reading Comprehension
- Unknown vocabulary density and reading comprehension: Replicating Hu & Nation (2000)
- Effects of graded input on reading comprehension and motivation (i+1 vs i-1 study)