
Track five numbers: vocabulary size, error rate, lexical sophistication, communicative task success, and a periodic CEFR check. Together they catch what a “feels more fluent” gut check misses, because they mix a growth measure (vocabulary), a precision measure (errors), and an outcome measure (can you actually do the task). Most learners see a measurable shift in at least two of these within 4 to 12 weeks, if they’re testing consistently and not just studying more.
TL;DR:
- Vocabulary size estimates recognition of up to 20,000 word families, but mastery of top frequency bands better predicts real reading and listening comprehension.
- Error rate reliably indicates progress, dropping from around 20.7 errors per 100 tokens at beginner levels to about 4.0 at advanced levels over months of consistent testing.
- Lexical sophistication scores like MTLD or MATTR measure word variety and complexity, remaining independent of sentence length and useful for tracking vocabulary growth.
- Measuring receptive skills through comprehension of texts and audio provides a more accurate picture than self-estimates or error counts alone.
- Regular, quick assessments of vocabulary, speech, and errors with tools like WordByWord can be done in just 20 minutes a week to monitor long-term progress effectively.
Table of Contents
- What Each Language Progress Metric Actually Measures
- How to Measure These Metrics Without a Lab
- Matching Metrics to the Skill You’re Actually Building
- The Tools That Actually Produce These Numbers
- Turning Raw Numbers Into Goals You Can Hit
- How WordByWord Maps to the Metrics That Matter
- Receptive Skills Move Differently Than Productive Ones
- Fluency and Pronunciation Deserve Their Own Column
- Motivation and Engagement Are Metrics Too
- Why Self-Assessment Still Has a Place Next to Test Scores
- Cultural Competence Belongs on the Scoreboard
- WordByWord Team Perspective: Match the Metric to the Stage
- Track Your Vocabulary Metrics Without a Separate Study Session
- Where to Run These Tests Yourself
- Sources
What Each Language Progress Metric Actually Measures
Vocabulary size and vocabulary level are not the same thing, and mixing them up wastes study time. Size tells you the raw count of word families you recognize, often estimated up to 20,000 families on tools like the Vocabulary Size Test. Level tells you which frequency bands you’ve mastered, the top 1,000 words versus the next 5,000. A learner who knows 4,000 words scattered across rare, low-frequency terms reads worse than one who has a tight 3,000-word grip on the most common bands, because frequency bands predict text coverage far better than raw count does.
Accuracy, or error rate, is the metric most learners ignore and shouldn’t. Corpus research on learner essays shows gold-standard error density falling from roughly 20.7 errors per 100 tokens at A1 down to about 4.0 at C2, a nearly fivefold drop across the full proficiency range. That makes error rate one of the most reliable single numbers for tracking real progress over months, because it moves in one direction as skill builds and rarely fluctuates the way a vocabulary quiz score can from day to day.
Lexical sophistication picks up where simple vocabulary counts leave off. Tools that compute MATTR or MTLD measure how varied and advanced your word choice is within a sample of speech or writing, and these scores correlate with proficiency independently of sentence length. Sentence length itself is a weak complexity signal. A beginner can string together a 25-word run-on with three clauses and zero subordination; an advanced speaker often writes shorter, denser sentences. Clause density and dependency distance are better complexity proxies than word count per sentence.
CEFR and ACTFL round out the picture by giving you a shared vocabulary for level, not just a private number.
- Vocabulary size: total word families recognized, tested via recognition or definition tasks.
- Error rate: gold edits per 100 tokens in a writing or transcribed speech sample.
- Lexical sophistication: MTLD or MATTR score, or share of low-frequency words used.
- Communicative success: whether you completed a real task (ordered food, resolved a complaint) without breakdown.
- CEFR/ACTFL level: a standardized band from A1 to C2, cross-checked against the Council of Europe’s self-assessment grid.
How to Measure These Metrics Without a Lab
You don’t need a university research budget to get numbers as good as the ones cited above. You need a repeatable protocol and about 20 minutes a week.
- Run an adaptive two-phase vocabulary test. Recognition-only tests inflate scores because learners overclaim words they half remember. A two-phase design, recognition followed by a definition check, corrects for that and can deliver a defensible estimate in 6 to 10 minutes. Bilingual versions of the 1,000 and 2,000-level tests exist for lower-proficiency learners who’d otherwise guess blindly on an English-only interface.
- Record 2 to 5 minutes of unscripted speech once a month. Talk about your weekend, describe a photo, argue a small opinion. Transcribe it (a phone voice-memo app plus a free transcription tool works fine) and count filler words, false starts, and self-corrections. That gives you a rough fluency proxy alongside your error count.
- Collect a 300 to 500-word writing sample and count gold edits. A gold edit is any correction a competent native speaker would actually make, not just grammar-checker flags. Divide by word count, multiply by 100, and you have your error rate per 100 tokens, directly comparable to the corpus benchmarks above.
- Run a CEFR-aligned placement check every quarter. Quarterly is often enough. Monthly level testing usually just measures test familiarity, not real gains.
Pro Tip: Keep every writing sample and recording in one dated folder. Six months in, listening to your first sample back is more motivating than any single test score, because you’ll hear filler words you don’t say anymore.
Weekly, keep a two-minute exposure log: how many new words you met, how many felt familiar. Monthly, do the speaking and writing samples. Quarterly, take the level test. That cadence produces enough data to see a trend without turning language learning into constant self-exam.
Matching Metrics to the Skill You’re Actually Building
Not every metric applies equally to every skill, and testing writing accuracy tells you almost nothing useful about your listening comprehension.
For reading, the number that matters most is text coverage: what percentage of words in a given article or book you already know. Pair that with a timed comprehension recall test, read a passage, close it, summarize what you remember.
For listening, run the same coverage logic against graded audio, then check comprehension through dictation or a short written summary of what you heard. Listening lags reading for most learners because there’s no rereading a sentence you missed.
For speaking, track task completion rate (did you finish the exchange without switching to your native language), error rate from the transcript, and speech rate measured in words per minute alongside hesitation markers.
For writing, gold edits per 100 tokens and lexical sophistication (MTLD or the share of low-frequency words you use unprompted) are your two anchor numbers.
- Vocabulary exposure sits underneath all four skills: how often you encounter a word and whether it survives a spaced-repetition review determines whether any of the above numbers move at all.
The Tools That Actually Produce These Numbers
Most of these metrics are useless if measuring them takes longer than studying does. The right tool produces a number in minutes, not hours.
- Adaptive vocabulary tests give you a size estimate with a stated error margin; look for two-phase designs since single-phase recognition tests overstate results.
- Browser-based vocabulary trackers log exposure frequency automatically as you read or watch content, then export word lists to Anki, Quizlet, or CSV for spaced-repetition review, which is far less tedious than typing every unknown word into a spreadsheet by hand.
- Transcription and analysis pipelines turn a voice memo into a transcript, then run that transcript through open text-analysis tools that output CEFR-adjacent estimates, MTLD scores, clause density, and error counts. Projects like LexiTrack show this pipeline is feasible without a linguistics degree.
- A good progress dashboard shows a moving average (not raw daily noise), the distribution of your vocabulary across learning stages (new, learning, mastered), your spaced-repetition retention rate, and a visual flag when a number stalls for three cycles straight.
Turning Raw Numbers Into Goals You Can Hit
Numbers only help if you attach a target and a deadline to them.
- Map vocabulary size to CEFR loosely, not precisely. Roughly 3,000 to 5,000 words tends to land near B2, with higher ranges needed for C1 and C2, though individual variation is real. Use it as a compass, not a scoreboard.
- Expect error-rate gains to be gradual, not dramatic. A drop of a few points per 100 tokens over three months is a real, corpus-consistent signal. A drop to zero in two weeks means your test was too easy.
- Build a five-line scoreboard: vocabulary size, error rate per 100 tokens, MTLD score, task-completion rate, and SRS retention rate. Update it monthly, not daily.
- Watch for stagnation versus normal variance. One flat month is noise. Three flat months across two or more metrics simultaneously means it’s time to change your method, not just push harder on the same one.
How WordByWord Maps to the Metrics That Matter
WordByWord tracks several of these numbers automatically instead of asking you to run a separate test for each one. Every word you translate while reading or watching gets logged, and that exposure count feeds directly into your vocabulary-size trend over time.
- Stage distribution shows how much of your vocabulary sits at unknown, learning, or mastered, a direct proxy for lexical growth.
- Spotlight mode highlights unfamiliar words on the page itself, so exposure frequency builds without a separate study session.
- Comprehension level estimates what percentage of a text’s words you already know before you start reading, the same coverage metric that predicts reading ease.
- Spaced-repetition retention rate and streak data show whether new words are actually sticking, not just being reviewed once and forgotten.
The workflow is simple: expose yourself to real content, collect the words you don’t know, review them through spaced repetition, then check your stage distribution monthly.
Pro Tip: Export your WordByWord collection to CSV every quarter and cross-check the word count against a standalone vocabulary-size test. If the two numbers diverge sharply, one of your review habits needs adjusting.
Receptive Skills Move Differently Than Productive Ones
Listening and reading, the receptive skills, almost always outpace speaking and writing early in a learner’s timeline, and treating them with the same metric is a mistake. You can recognize a word passively long before you can produce it under time pressure, which is why a vocabulary-recognition test score tends to run higher than a speaking task score for the same learner at the same point in time.
For receptive skills, measure comprehension: percentage of a text or audio clip understood, tested through recall or summary tasks rather than multiple choice, since multiple choice lets you guess your way to a misleadingly high score. A comprehension check that asks you to retell what happened in your own words is harder to fake and more useful.
For productive skills, measure output under mild pressure: a timed writing sample, an unscripted 2 minute recording, a real conversation exchange. The gap between your receptive and productive scores is itself a useful number. A large gap, recognizing 4,000 words but comfortably producing only 800, tells you exactly where to spend the next study cycle: less passive exposure, more forced retrieval.
Don’t average receptive and productive scores into one blended number. That average hides the exact information you need, which skill is dragging the other down. Track them side by side instead, and revisit the gap every quarter alongside your CEFR check.
Fluency and Pronunciation Deserve Their Own Column
Fluency is not the same as accuracy, and conflating the two leads to bad self-assessment. A learner can speak with almost no grammar errors and still sound stilted, pausing every third word to retrieve vocabulary. Another learner might make more small mistakes but talk at a natural pace with minimal hesitation. Both are making progress, just on different axes.
Measure fluency through speech rate (words per minute) and hesitation markers, filler words, false starts, unnaturally long pauses, counted from a recorded sample. A rising speech rate with a falling hesitation count over several months is one of the clearest signs of real gains, often visible before your error rate improves much at all.
Pronunciation is harder to self-score, but intelligibility is a workable proxy: can a native speaker understand you on the first try, without asking you to repeat yourself? Track how often that happens in real exchanges rather than chasing a “correct” accent, since intelligibility, not accent reduction, is the actual goal for almost every practical use case. Recording yourself monthly and comparing samples six months apart usually reveals more about pronunciation drift than any app score will.
Motivation and Engagement Are Metrics Too
Skill metrics tell you what you can do. Engagement metrics tell you whether you’ll keep doing it long enough for those skill numbers to move at all, and ignoring this side of tracking is why so many learners plateau, not because their method failed, but because they quietly stopped applying it.

Track study frequency (sessions per week, not just total hours), streak length, and voluntary exposure, time spent with the language outside of assigned study, reading an article because you wanted to, not because it was homework. A drop in voluntary exposure while formal study time stays flat is an early warning sign that motivation is fading before your test scores show it.
For classroom settings, educators can track group-level engagement alongside individual skill dashboards: attendance patterns, homework completion rate, and how often students choose the language for anything outside class requirements. A class with strong average CEFR gains but declining voluntary engagement is a class heading for a slump next term, even if this term’s numbers look fine.
Why Self-Assessment Still Has a Place Next to Test Scores
Objective tests measure what you can prove under test conditions. Self-assessment measures what you actually do with the language day to day, and the two frequently disagree in informative ways.
The CEFR self-assessment grid exists precisely because learners are often reasonably accurate judges of their own functional ability when given concrete “I can” statements rather than a vague “how good are you” question. “I can follow the plot of a TV drama” is a more honest self-check than “how’s your listening?”
Use self-assessment to catch what tests miss: confidence in unpredictable real-world situations, comfort switching topics mid-conversation, willingness to speak up rather than defer to English. A learner who scores B1 on a vocabulary test but rates themselves confidently at “can handle most travel situations” on the CEFR grid is probably underselling their vocabulary and overselling their functional range, or vice versa. Either mismatch is useful information, not noise to average away.
Cultural Competence Belongs on the Scoreboard
Vocabulary and grammar metrics say nothing about whether you understand why a direct request sounds rude in one language and perfectly normal in another. Cultural competence, knowing the unwritten rules around formality, humor, silence, and directness, often determines whether a technically correct sentence actually lands the way you intended.

There’s no equivalent of a vocabulary-size test for this, but you can still track it practically: note moments where a native speaker reacted unexpectedly to something you said, and log whether you understood why afterward. Over time, the frequency of those confused moments should drop even if your grammar accuracy plateaus.
For classroom settings, educators sometimes score this through scenario-based tasks, how would you decline an invitation politely, how would you address someone older than you, and track improvement in appropriateness rather than grammatical correctness alone. It’s a softer metric than error rate, but ignoring it entirely means missing half of what real proficiency looks like in practice.
WordByWord Team Perspective: Match the Metric to the Stage
Beginners should watch coverage and high-frequency vocabulary, not obscure words, plus whether simple tasks succeed. Intermediate learners get the most out of tracking error-rate reduction and lexical sophistication, since that’s the plateau most self-directed learners hit. Advanced learners should shift to low-frequency vocabulary and precision, prepositions, punctuation, nuance. Educators do best combining individual dashboards with a group view, since a class average can hide a student quietly falling behind.
— WordByWord Team
Track Your Vocabulary Metrics Without a Separate Study Session
WordByWord is built for exactly the exposure-to-retention pipeline this article recommends: it logs which words you meet in real content, tracks how they move through learning stages, and measures spaced-repetition retention automatically instead of asking you to run a separate test every week.
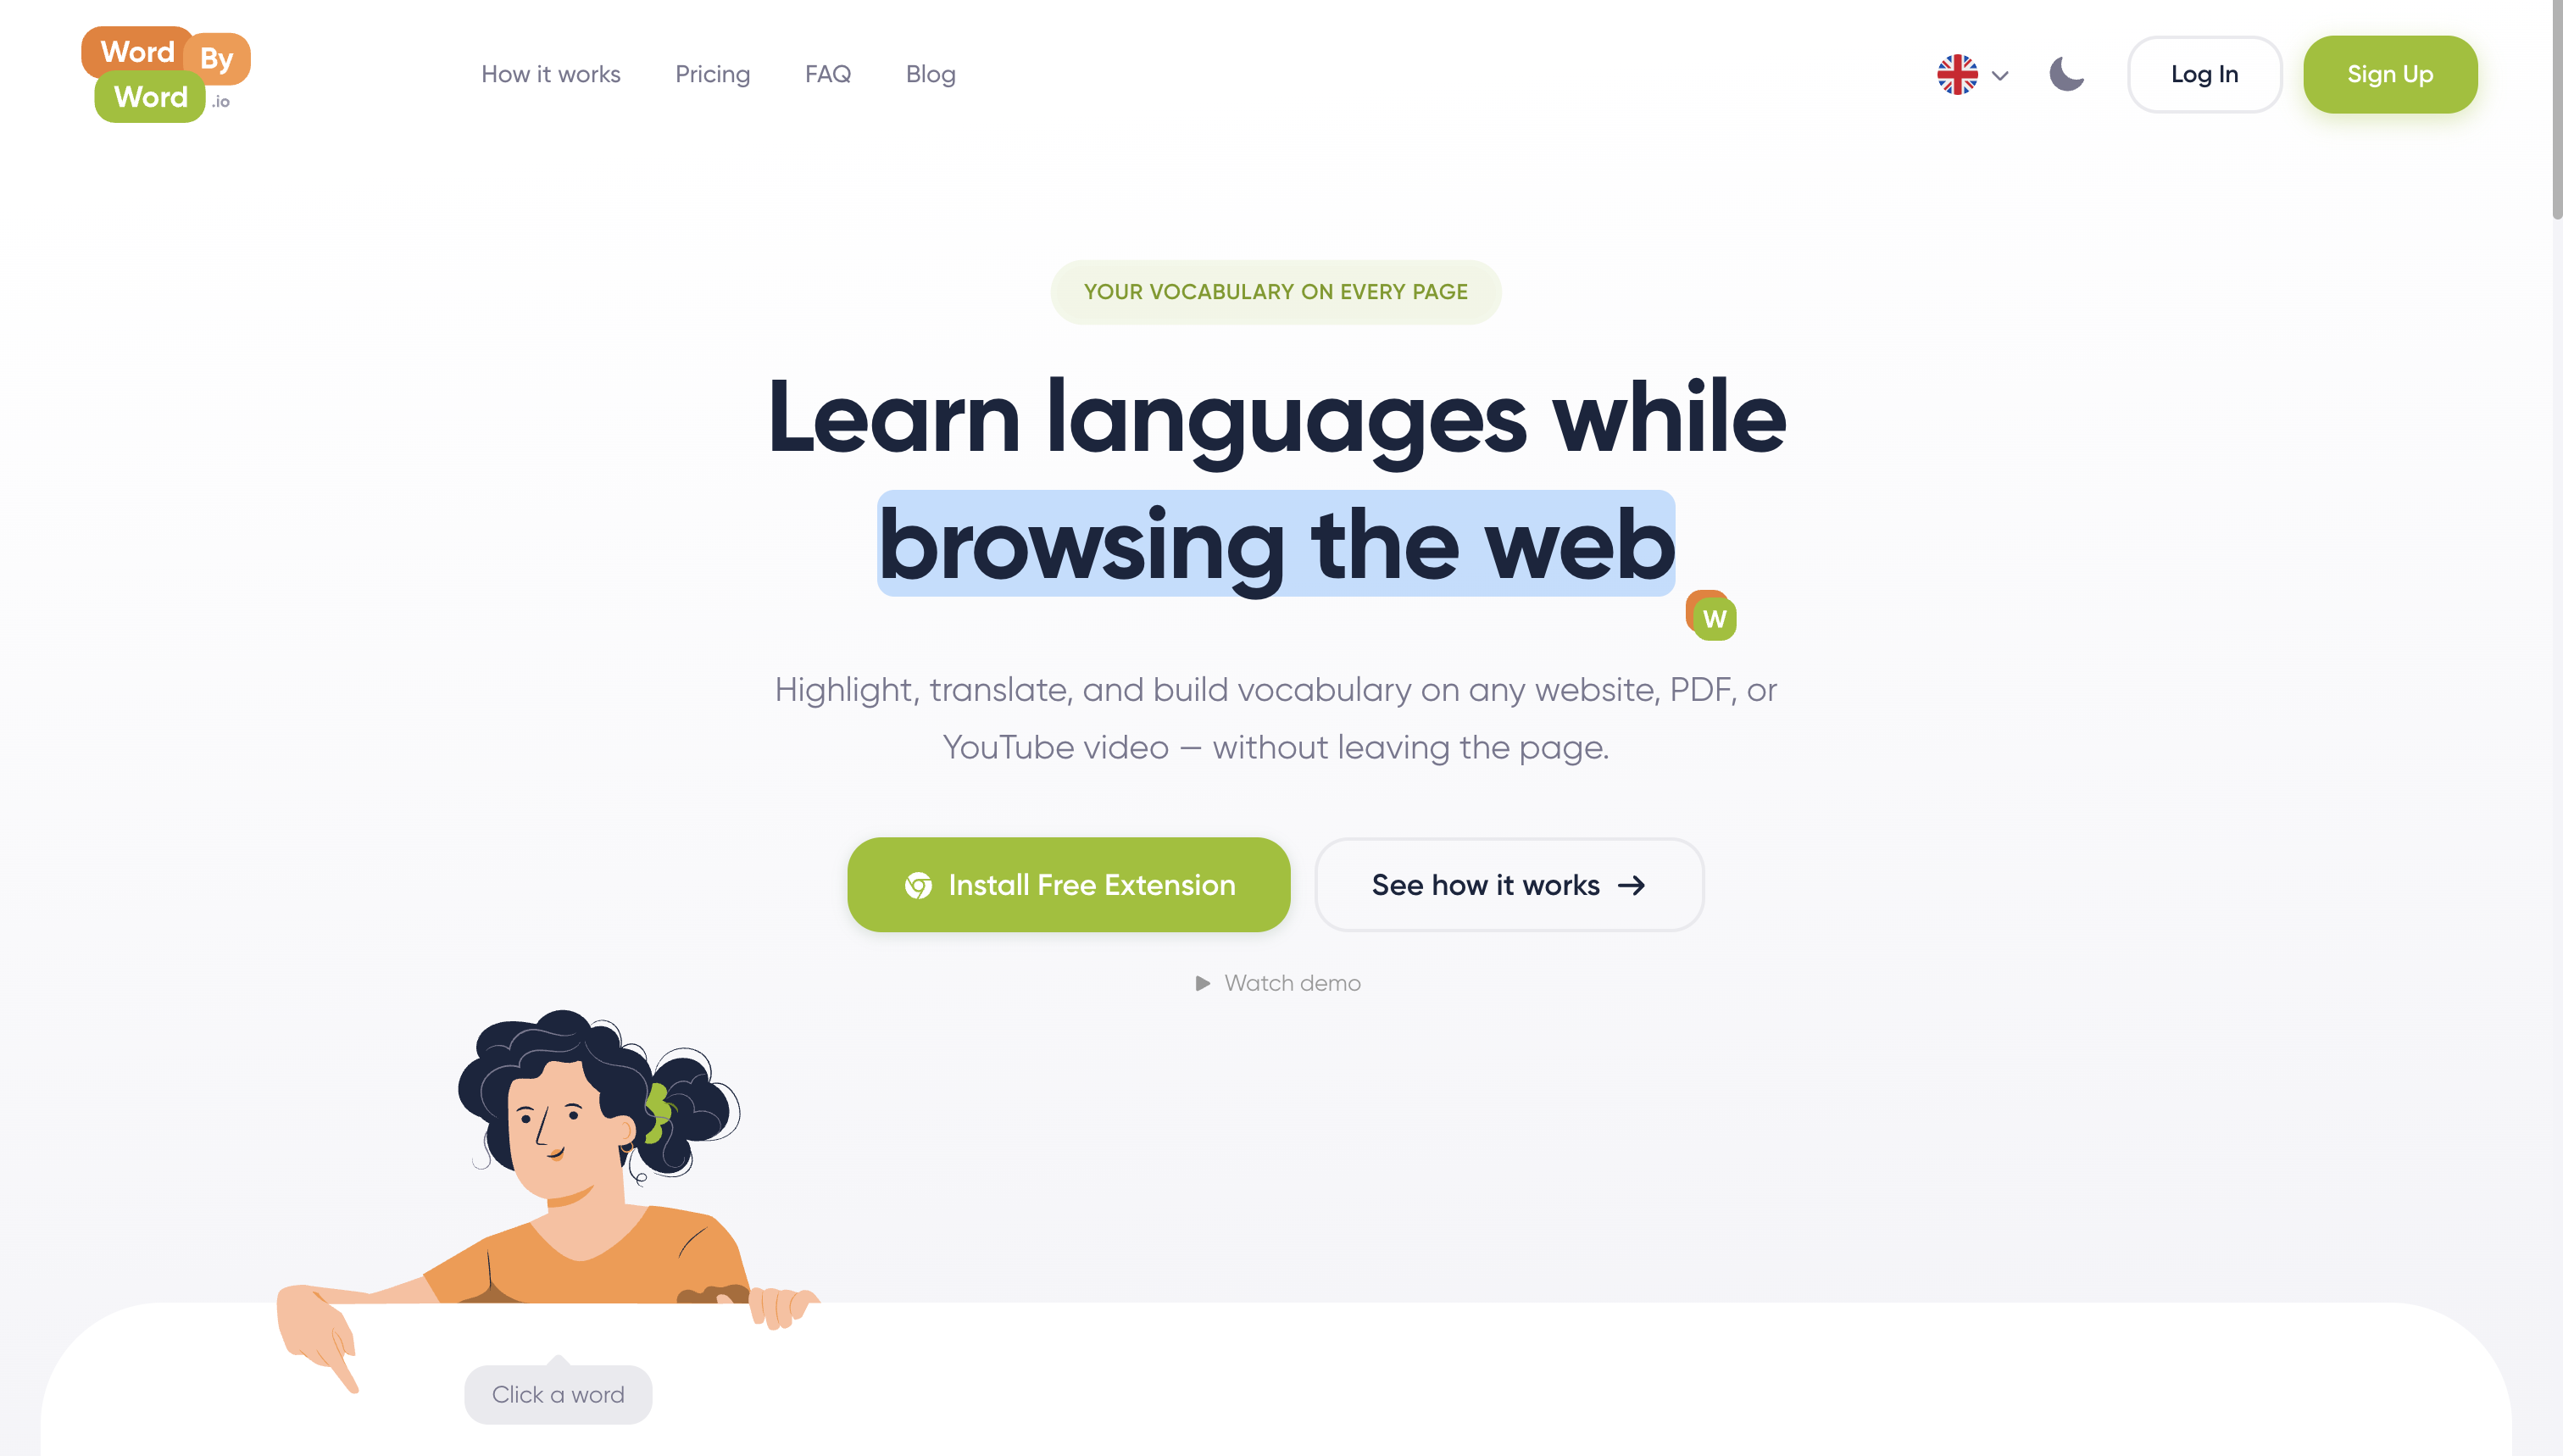
Spotlight mode highlights unknown words directly on any page, PDF, or YouTube video, so exposure tracking happens while you read normally rather than during a dedicated study block. Collections turn into flashcards automatically, with CSV import and export if you already track vocabulary in a spreadsheet or use Spanish vocabulary lists that actually improve your Spanish. Comprehension level tells you before you start reading whether a text actually matches your current vocabulary, saving you from picking material that’s either frustratingly hard or too easy to teach you anything.
Start with the free plan and let your stage distribution and streak data build for a few weeks before you check them against a standalone vocabulary test.
Where to Run These Tests Yourself
Run the actual measurements using vetted, research-backed tools rather than informal self-rating alone.
- CEFR self-assessment grid for level descriptors and “I can” statements across A1 to C2.
- Vocabulary Size Test resources for size and level testing, including bilingual versions.
- Dialang for a free multi-skill diagnostic across several languages.
- Free two-phase vocabulary test for a fast, overclaiming-resistant size estimate.
Sources
- ESL proficiency map (W&I + LOCNESS corpus analyses)
- Vocabulary tests — Paul Nation resources (Victoria University of Wellington)
- Whatsmyenglish
- CEFR: self-assessment grid (Council of Europe)